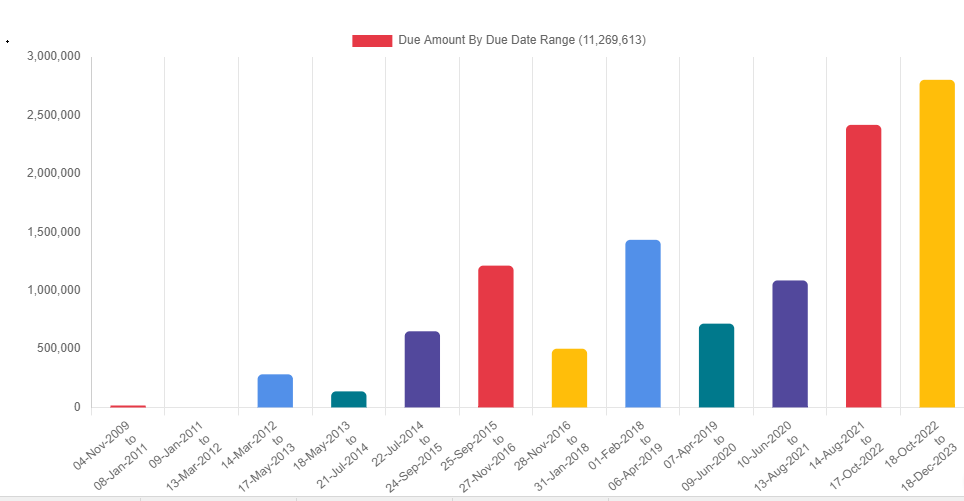
Loan Data Analysis is crucial part in loan management system module. The data analysis helps to visualize the data quickly and compare on different axis and categories. For example as shown in the chart above the loan due amount is compared over the period of date range.
As explained below in this article, minimum five data analysis modules are required in any loan management system.
- Days Past Due (DPD) Analysis – This provides the number of days recovery of a loan is not done. It helps in deciding late penalty charges, non performing assets (NPA) and decide the loan recovery performance.
- Recovery Amount Analysis – This helps in finding out the stages of due amount. It helps to identify the trend in due amount.
- Field Collection Analysis – This helps to identify the amount collected over the period of time. This trend helps to evaluate the business growth in near future.
- Recovery Agent Performance Analysis – This helps in agent work management. It helps to understand when the maximum recovery is done during the day and how effectively work can be allocated to recovery agents.
- Income and Expenses Analysis – This helps in analyzing profit and loss of the business.
Some of the charts explained below helps to understand loan data analysis. The data is provided from Jainam Software Loan Management System.
Collection Data Analysis
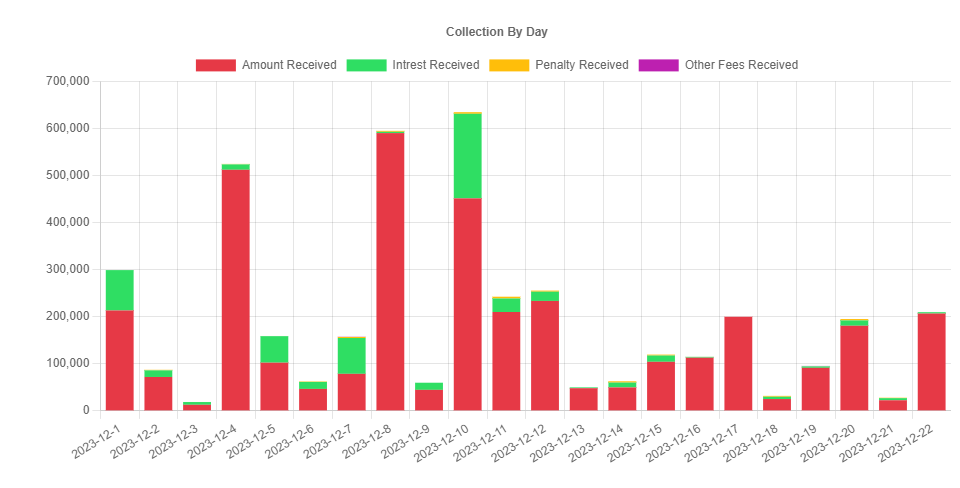
This chart shows day wise amount collection breakup into principal, interest and fees. It helps to understand the interest collection and comparing it with other days collection.
Due Amount Data Analysis
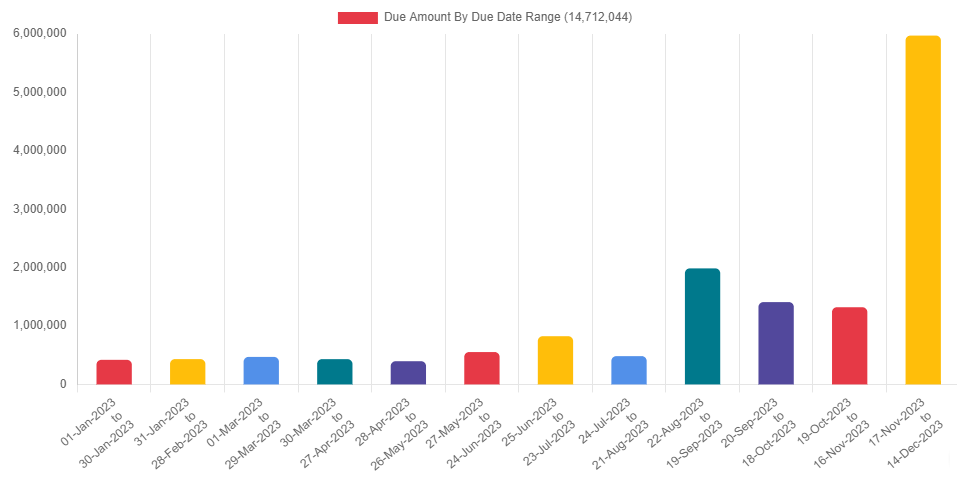
This chart provides information that there is some part of recovery pending for quite long period of time. And recovery backlog is increasing. This indicates that more focus has to be spent on loan recovery.
Income and Expenses Data Analysis
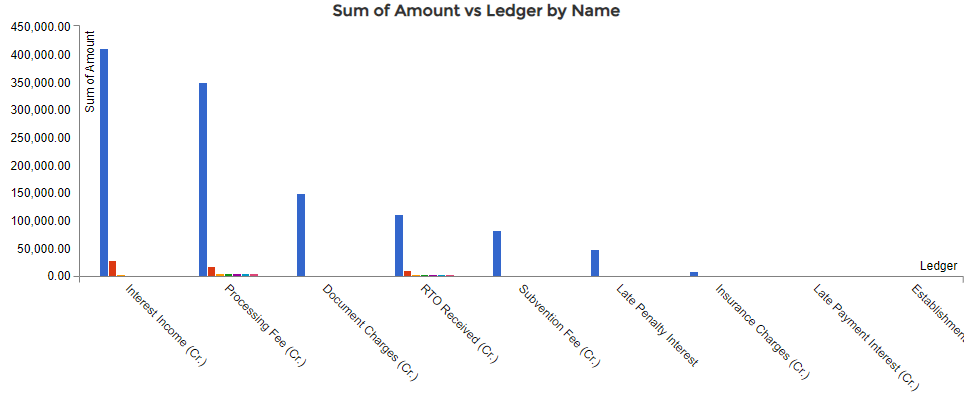
This chart provides comparison of different income ledgers. This chart shows that Loan Processing Fees income is the second largest income source.
Recovery Agent Performance
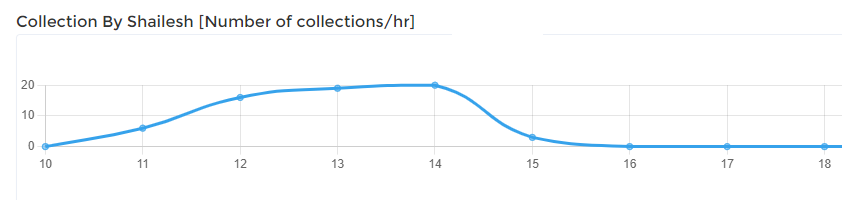
This graph helps to understand the collection trend of a recovery staff. Using this trend line, it is identified that there is less workload on staff after 3 PM which means this time can be utilized in other activities to increase the business output.